
River Oaks Real Estate Trends: What’s Driving Prices
November 21, 2025
November 21, 2025
Are River Oaks prices poised to climb, hold, or soften? If you are weighing a sale or a purchase in River Oaks or Afton Oaks, the answer depends on a few core drivers you can actually measure. With the right lens, you can see where you have leverage, where you need to move fast, and how to price or bid with confidence. In this guide, you will learn the metrics that matter, how to interpret them for luxury property, and what they mean for your next move. Let’s dive in.
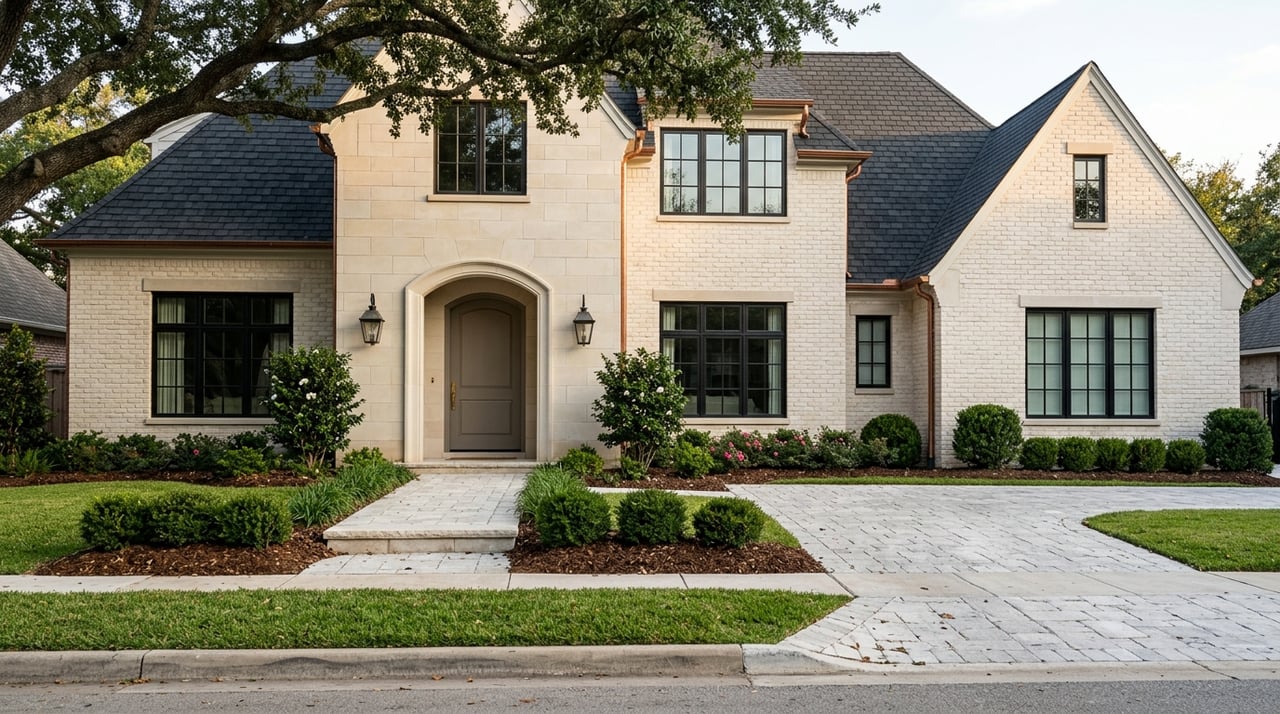
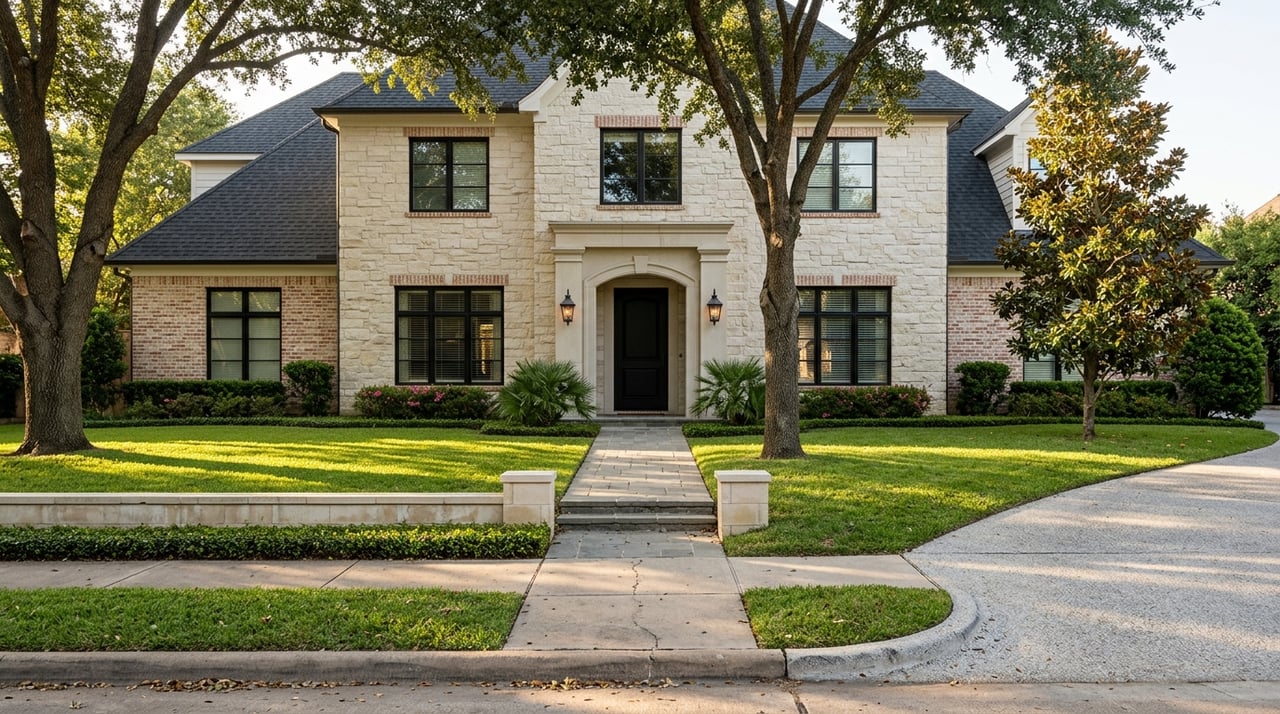
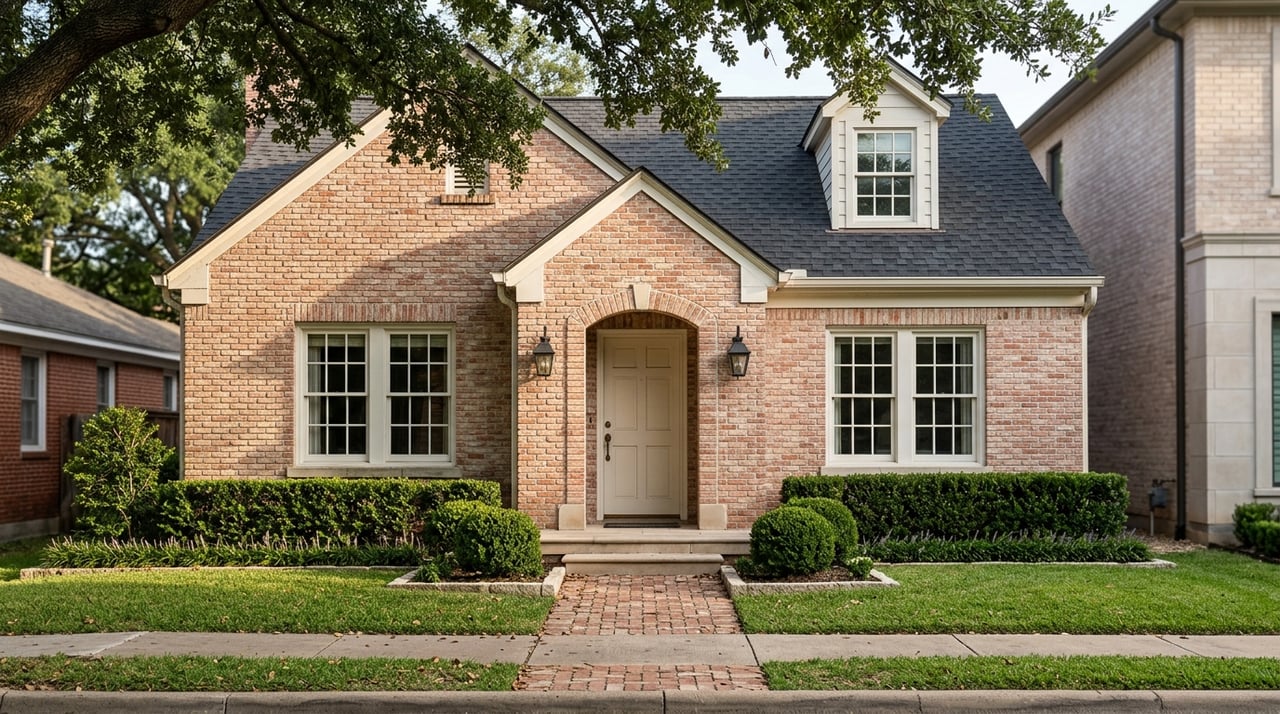
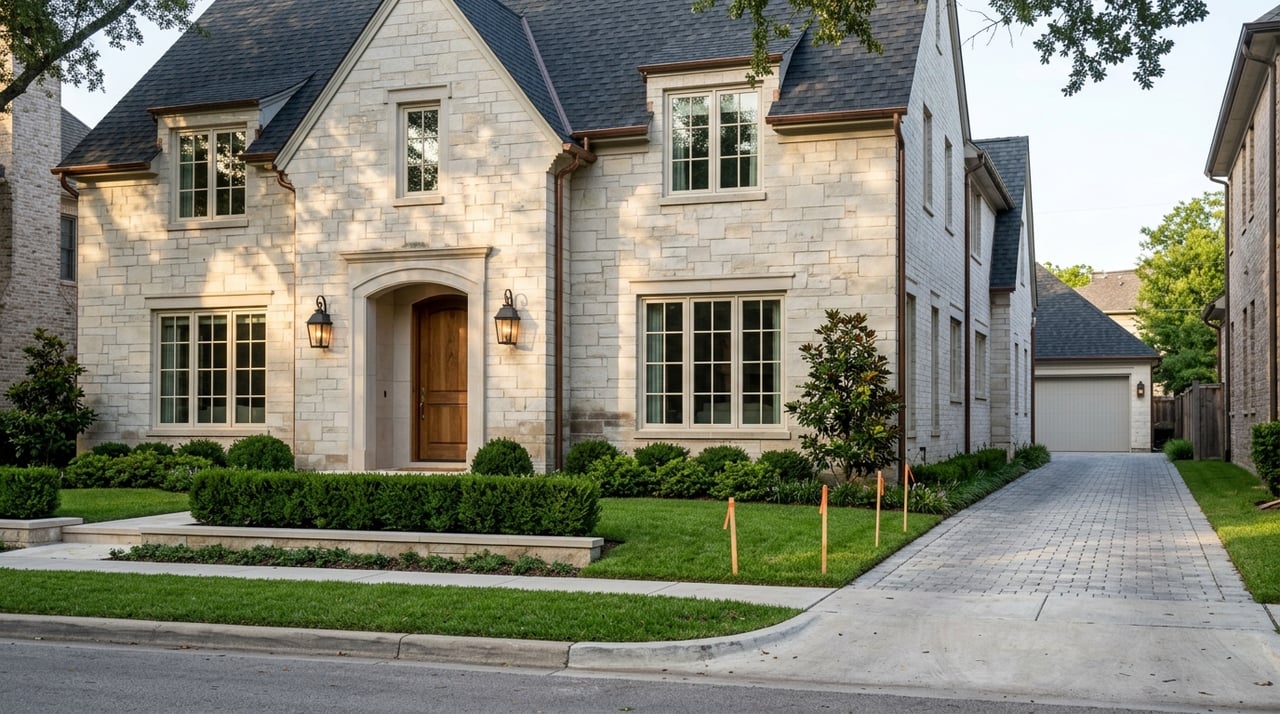
In River Oaks and Afton Oaks, pricing starts with the land. Lot size, configuration, and street position often set the floor, while curb appeal, architectural pedigree, and the quality of renovation shape the premium. Newer rebuilds and turn-key renovations tend to command higher prices because they deliver modern layouts and finishes without the time and risk of construction.
Macro conditions matter too. Mortgage rates and lending availability can widen or narrow the buyer pool. Property taxes and insurance costs affect carrying costs and buyer budgets. Seasonality influences showing activity, and discretionary luxury buyers may enter or exit the market based on broader wealth trends.
Supply is tight at the top end. Many homes are custom builds on large lots, so replacement cost and land value often dominate. Off-market activity and pocket listings are also common, which can make public inventory look lower than true supply.
Months of Inventory (MOI) shows the balance between supply and demand. The formula is simple: active listings that match your product type divided by the average monthly closed sales of the same type. Under roughly 4 months is typically a seller’s market, 4 to 6 months is balanced, and above 6 months leans buyer-friendly. In luxury segments, MOI can run higher and still support firm pricing because turnover is lower.
To make MOI meaningful, filter by product type and price band. A single trophy listing can skew counts. Compare single-family homes separately from condos or land, then look at bands such as entry-luxury, mid-luxury, and trophy.
Price per square foot (PPSF) is a helpful reference, not a rule. Larger luxury homes often show lower PPSF than smaller high-end homes because the land and fixed costs spread differently. Always compare apples to apples: similar lot size range, construction vintage, finish level, and true living area. Focus on the 25th, median, and 75th percentiles to see where a specific property sits in the distribution rather than relying only on a single median.
Beware of cross-neighborhood comparisons and streets with outsized land premiums. Renovation quality can justify major deviations from neighborhood medians. In River Oaks, location nuances and lot value can dominate PPSF.
Sale-to-list ratio, days on market, and price-reduction cadence reveal market power. Ratios near or above 98 to 100 percent signal strong pricing power. Ratios closer to 95 percent suggest buyers are negotiating. Watch the time to first price reduction and how many listings reduce price.
For luxury, initial list prices can be aspirational and marketing periods can be staged. Some transactions also happen off-MLS, so days on market may understate true marketing time. Track the first list price and the final list price to understand strategy and movement.
Both areas are anchored by single-family homes, with a mix of original mid-century properties, high-end renovations, tear-down lots, and new construction. Condos and townhomes exist but represent a smaller share at the ultra-luxury level and should be analyzed separately.
Lot size and land value are central. Larger parcels and favored blocks, including those near notable amenities, often trade with meaningful premiums. New construction and rebuilds add fresh “move-in ready” inventory, but they do not increase the number of lots. Construction costs and lot scarcity can widen the gap between older homes and new builds.
Flood and elevation considerations can affect insurability and buyer comfort, so confirm history and insurance expectations during due diligence. Property tax valuations and appeal outcomes can influence carrying costs in non-linear ways at the luxury tier.
When you know your band’s numbers, you can time and price with precision.
Your approach should track your band’s MOI and list-to-sale behavior.
You can bring clarity to your decision by assembling a focused data set.
This approach will show where demand is strongest, where pricing is sticky, and where leverage is shifting.
Rebuilds and new construction capture buyers seeking modern design and higher usable square footage. They typically sell at a premium, but the economic gap between older stock and new builds can widen when construction costs rise. Monitor permit activity to understand the near-term pipeline. Remember, more rebuilds add product variety but do not increase lot supply, so land-driven pricing remains central.
You deserve advice that blends data and presentation. Our approach is simple and proven:
If you are planning a move in River Oaks or Afton Oaks, we would love to help you make the right call. Start the conversation with Holly Campbell Minter Properties.
Stay up to date on the latest real estate trends.


Get In Touch With Our Team To Learn More